3.31 Poverty Rate
Data Summary:
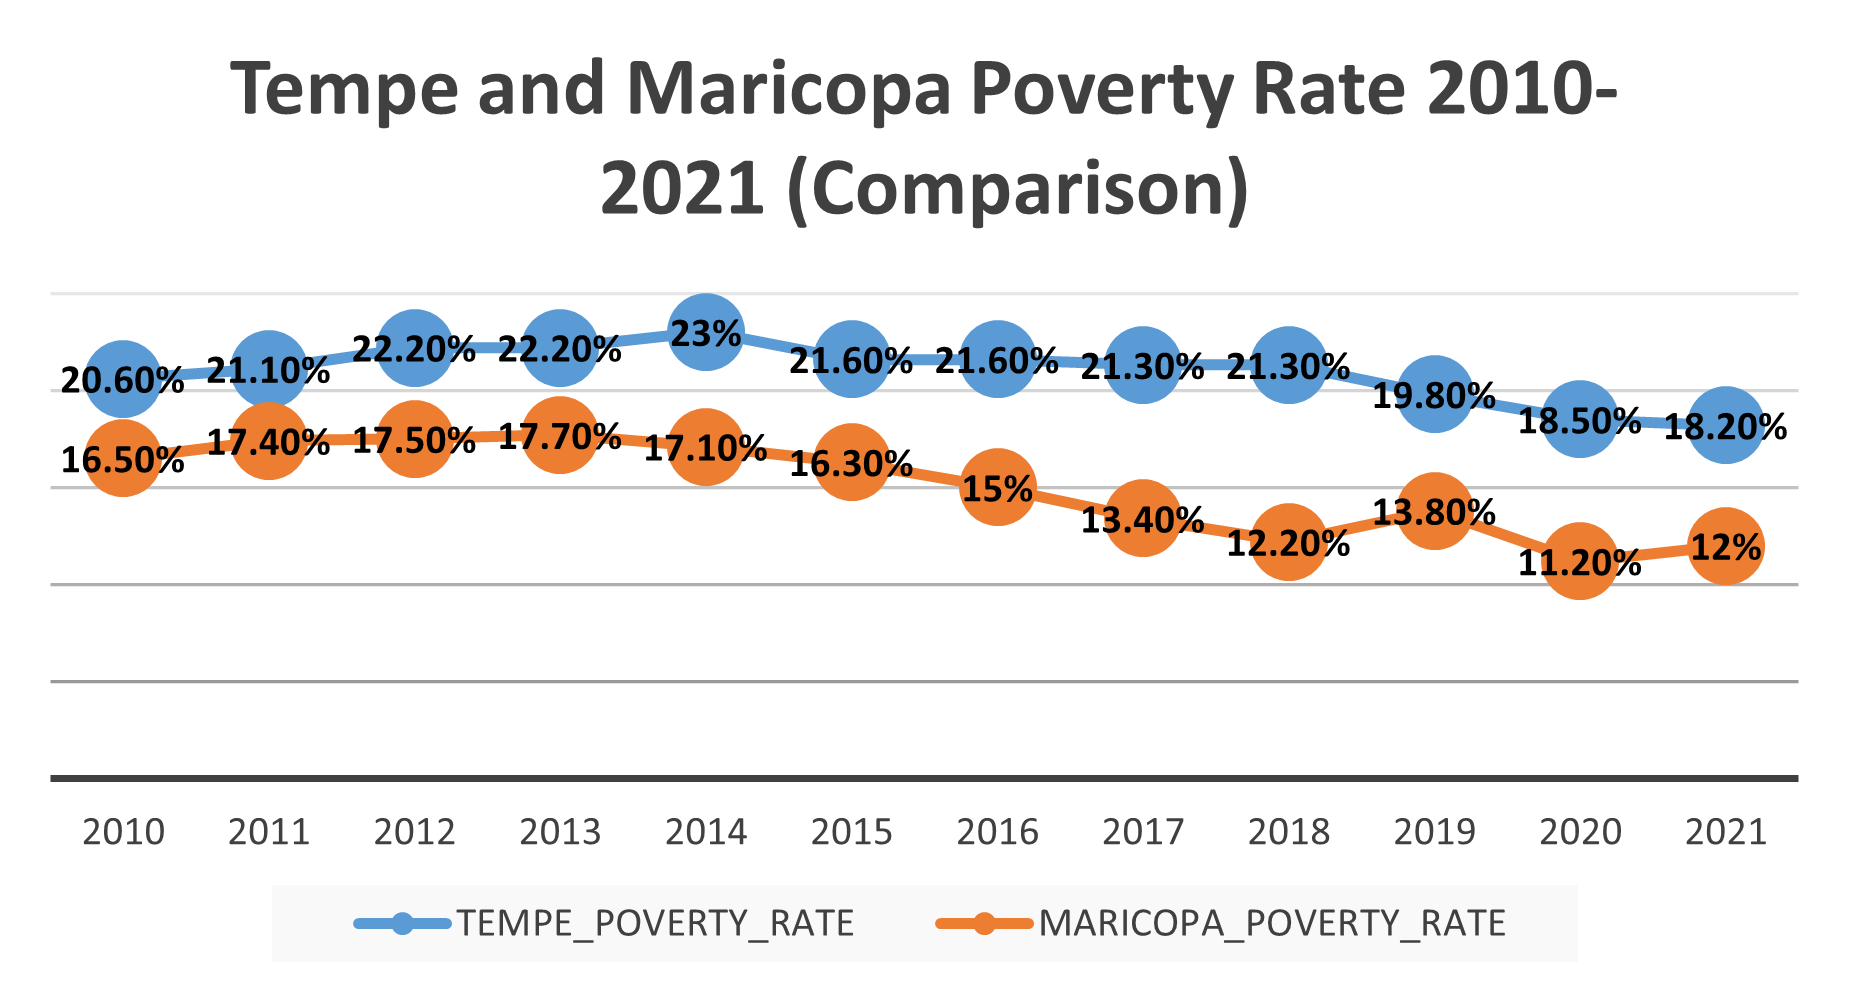
Tempe and Maricopa County poverty rates from 2010 to 2021 show trends of decline, though Tempe's poverty rate consistently remains higher than the county average.
Key Observations:
1. Discrepancy Between Tempe and Maricopa:
Tempe's poverty rate consistently exceeds Maricopa County's by a noticeable margin (ranging from 3 to 7 percentage points). This suggests that Tempe faces more localized economic challenges compared to the broader county.
2. Peak and Decline:
Both regions experienced a peak in poverty around 2014, with Tempe reaching 23% and Maricopa County at 17.7%. From 2014 to 2021, both areas saw improvement, though Maricopa's recovery has been more pronounced.
3. Slower Progress in Tempe:
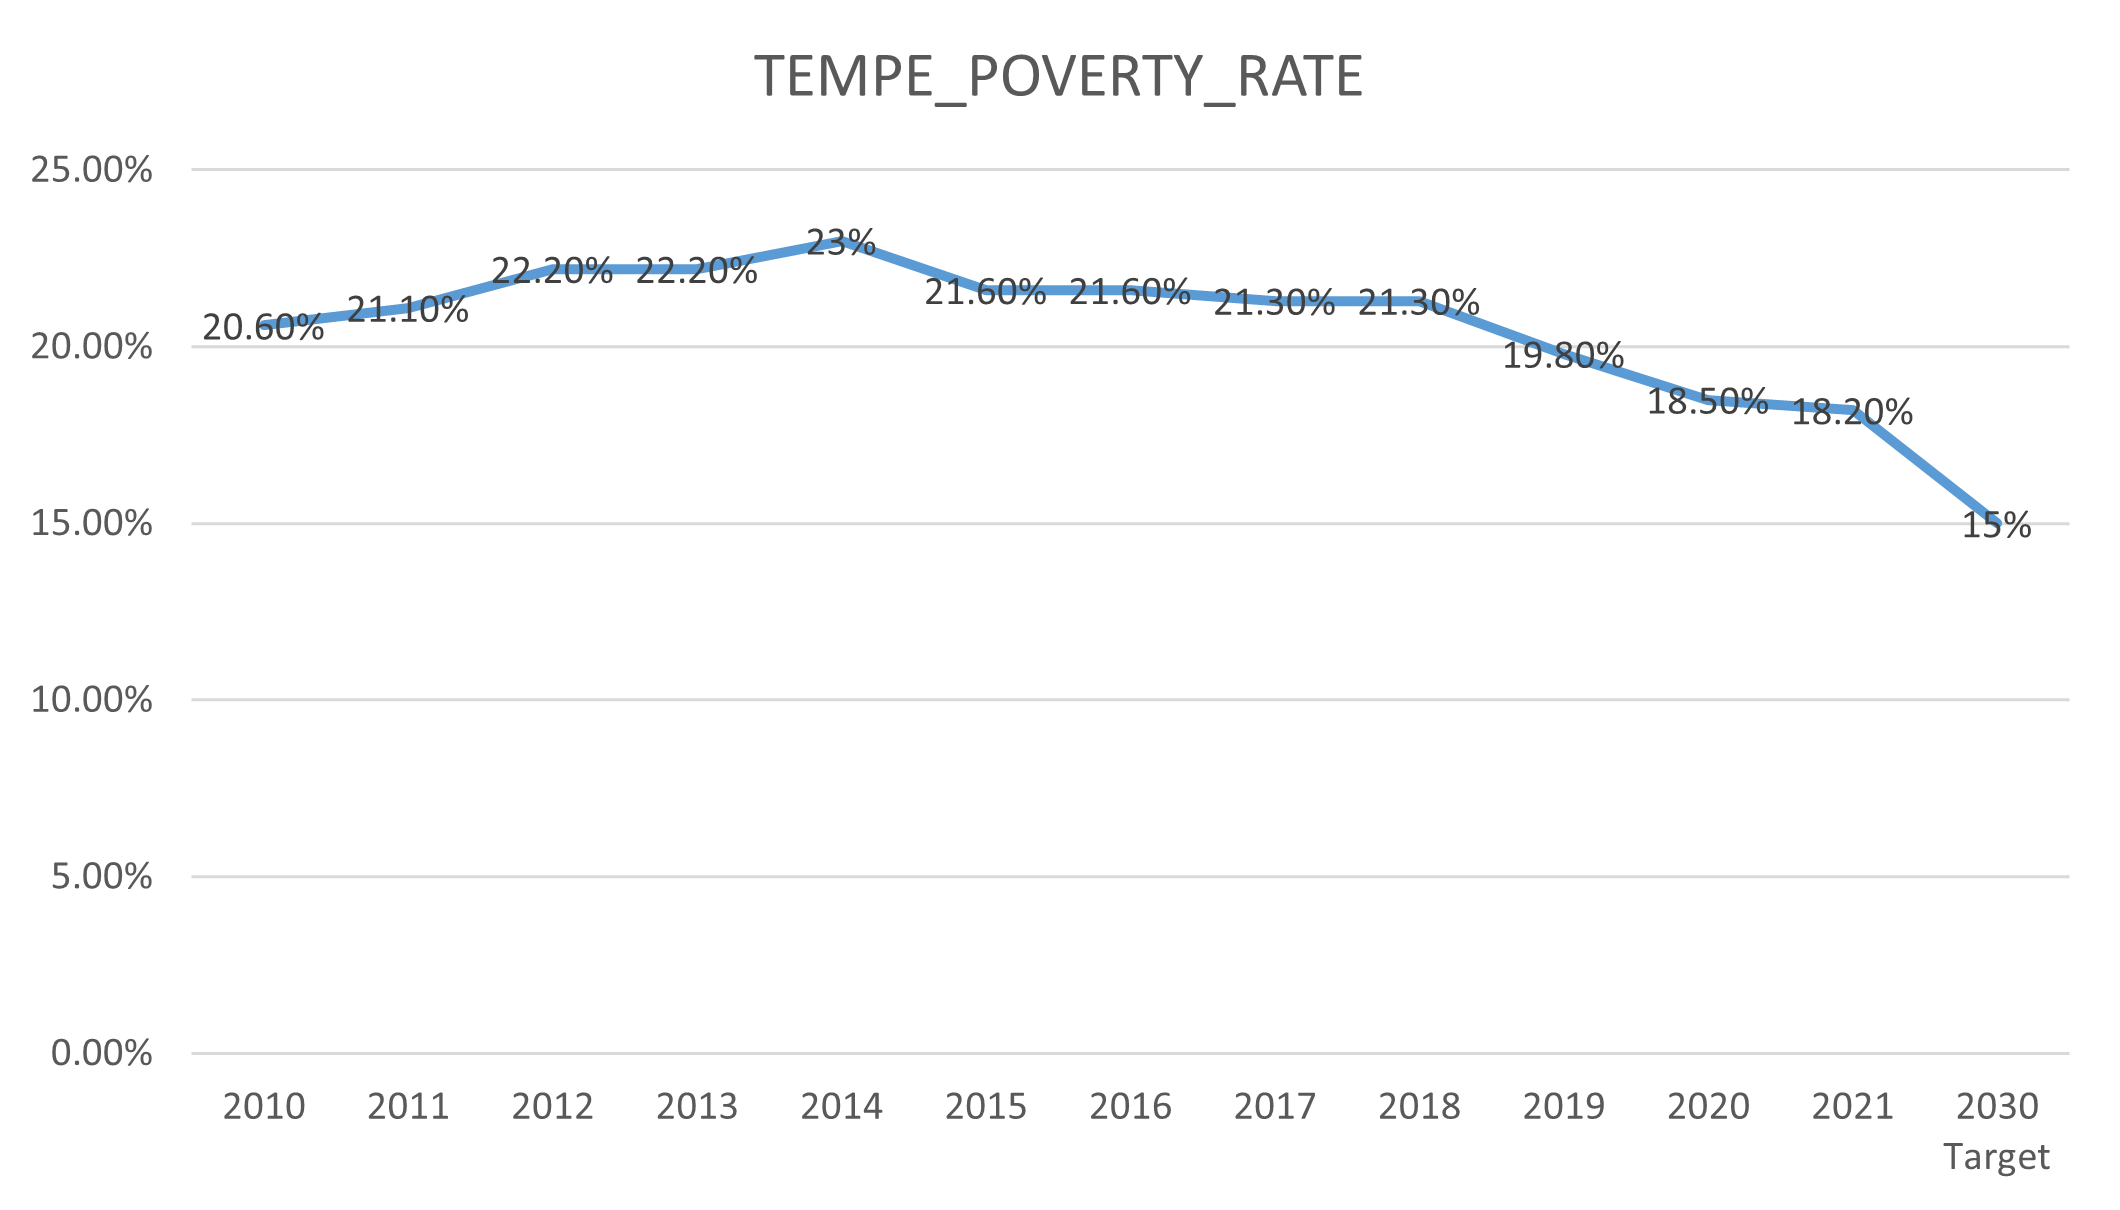
Tempe's decline from 23% in 2014 to 18.2% in 2021 represents progress, but the pace is slower than Maricopa's. If Tempe continues at this pace, it may not meet the 2030 target without significant intervention.
4. 2030 Target:
Tempe needs to reduce its poverty rate by 3.2 percentage points to meet the 15% goal.

