4.19 Municipal Carbon Neutrality
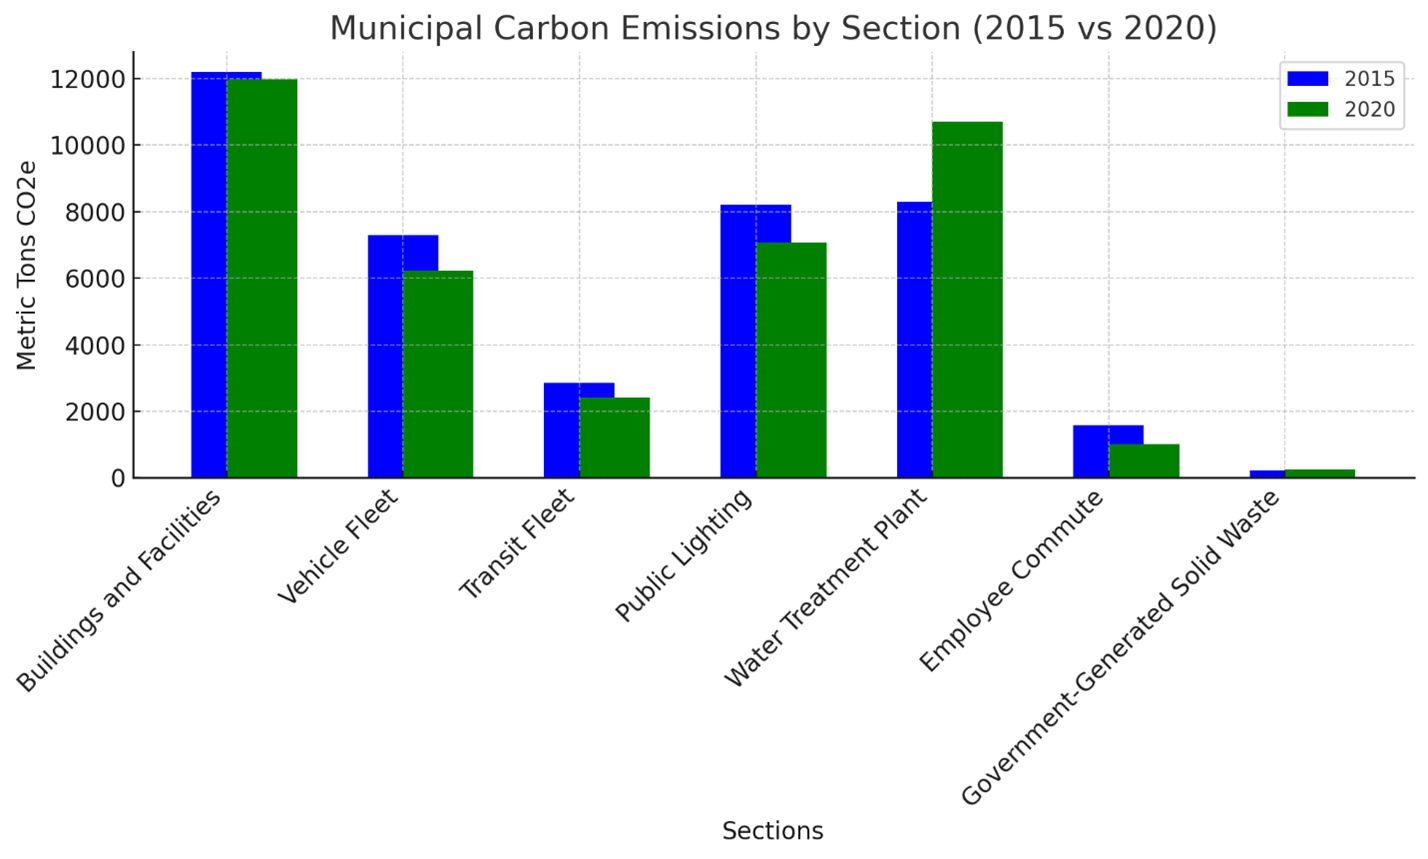
The data represents the total metric tons of CO2 equivalent (CO2e) emissions produced by a municipality in two years: 2015 and 2020. These emissions are categorized into seven sections, reflecting different activities or sources. Additionally, the 2050 target is set to achieve carbon neutrality, with total emissions reaching zero.
1. Buildings and Facilities:
In 2015, buildings and facilities produced 12,203 metric tons of CO2e, and by 2020, this decreased slightly to 11,983 metric tons.
The marginal reduction indicates efforts to either improve energy efficiency or shift towards cleaner energy sources, but the change is small, suggesting room for more aggressive action.
2. Vehicle Fleet:
The vehicle fleet emissions dropped from 7,297 metric tons in 2015 to 6,219 metric tons in 2020.
This is a 14.8% reduction, which could be attributed to more fuel-efficient vehicles, fleet downsizing, or shifts towards electric or hybrid vehicles.
3. Transit Fleet:
The emissions from the transit fleet decreased from 2,846 metric tons in 2015 to 2,415 metric tons in 2020.
This 15% reduction may reflect improved fuel efficiency, better transit routes, or a move towards more sustainable transit solutions.
4. Public Lighting:
Public lighting emissions decreased from 8,220 metric tons to 7,084 metric tons.
This is a 13.8% reduction, likely due to improvements such as switching to LED streetlights or other energy-efficient technologies.
5. Water Treatment Plant:
The water treatment plant saw an increase in emissions from 8,300 metric tons in 2015 to 10,698 metric tons in 2020, an approximate 29% increase.
This increase is notable and may be due to growing demand for water treatment, operational inefficiencies, or the use of more energy-intensive processes.
6. Employee Commute:
Employee commute-related emissions fell from 1,576 metric tons to 1,004 metric tons, a 36.3% reduction.
This may reflect a shift to remote work policies, carpooling incentives, or greater use of public transportation by employees.
7. Government-Generated Solid Waste:
Emissions related to solid waste increased slightly from 228 metric tons to 254 metric tons.
This is a 11.4% increase, which may point to higher waste production or less effective waste management strategies during this period.
Total Emissions:
2015 Total Emissions: 40,670 metric tons of CO2e.
2020 Total Emissions: 39,657 metric tons of CO2e.
This shows a 2.5% decrease in total emissions over the five-year period. While this reduction is in the right direction, it is modest and highlights the need for more aggressive measures to meet the 2050 target of zero emissions.
Interpretation and Recommendations:
1. Moderate Progress: The overall reduction in emissions (2.5%) suggests that efforts have been made, but they are not sufficient to meet the 2050 carbon neutrality target. The emissions from sections like buildings and facilities and public lighting have reduced modestly, while the vehicle fleet and employee commute sections showed stronger improvements.