4.20 Customer Satisfaction with Community Development Processes
1. Timeliness of Service
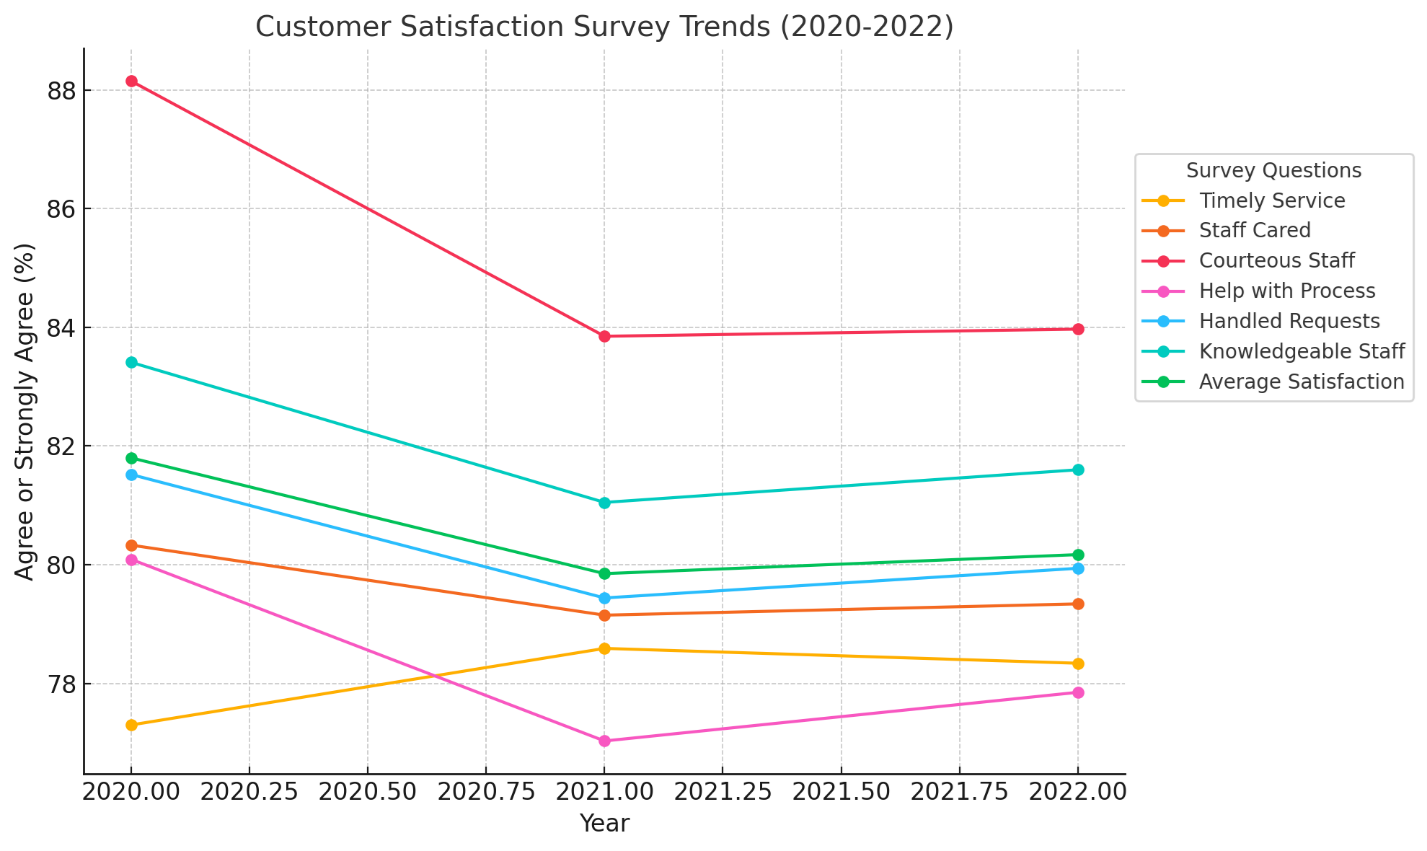
2020: 77.3% of respondents agreed or strongly agreed that staff served them in a timely manner.
2021: This increased slightly to 78.59%.
2022: The percentage remained relatively stable at 78.34%.
2. Staff's Concern for Projects
2020: 80.33% felt that the staff cared about their project.
2021: This dropped slightly to 79.15%.
2022: It improved slightly to 79.34%.
3. Courteousness of Staff
2020: 88.15% of respondents agreed that staff were courteous.
2021: This dropped to 83.85%.
2022: It remained stable at 83.97%.
4. Helpfulness in Understanding and Navigating the Process
2020: 80.09% felt the staff helped them understand and navigate the process.
2021: This dropped to 77.03%.
2022: It improved slightly to 77.85%.
5. Handling and Resolution of Requests
2020: 81.52% agreed that their requests were appropriately handled.
2021: This percentage dropped to 79.44%.
2022: There was a slight improvement to 79.94%.
6. Knowledgeability of Staff
2020: 83.41% believed the staff were knowledgeable.
2021: This dropped to 81.05%.
2022: It improved to 81.6%.
7. Overall Satisfaction (Average)
2020: The overall average satisfaction was 81.8%.
2021: This decreased to 79.85%.
2022: The average recovered slightly to 80.17%.
The data shows generally high levels of customer satisfaction across all metrics, though with some slight declines between 2020 and 2021, followed by a minor recovery in 2022. The primary areas for improvement include timely service and helping customers better understand the process. Courteousness remains a strong point, while consistent training and guidance can improve the staff's knowledge and ability to handle customer requests effectively.