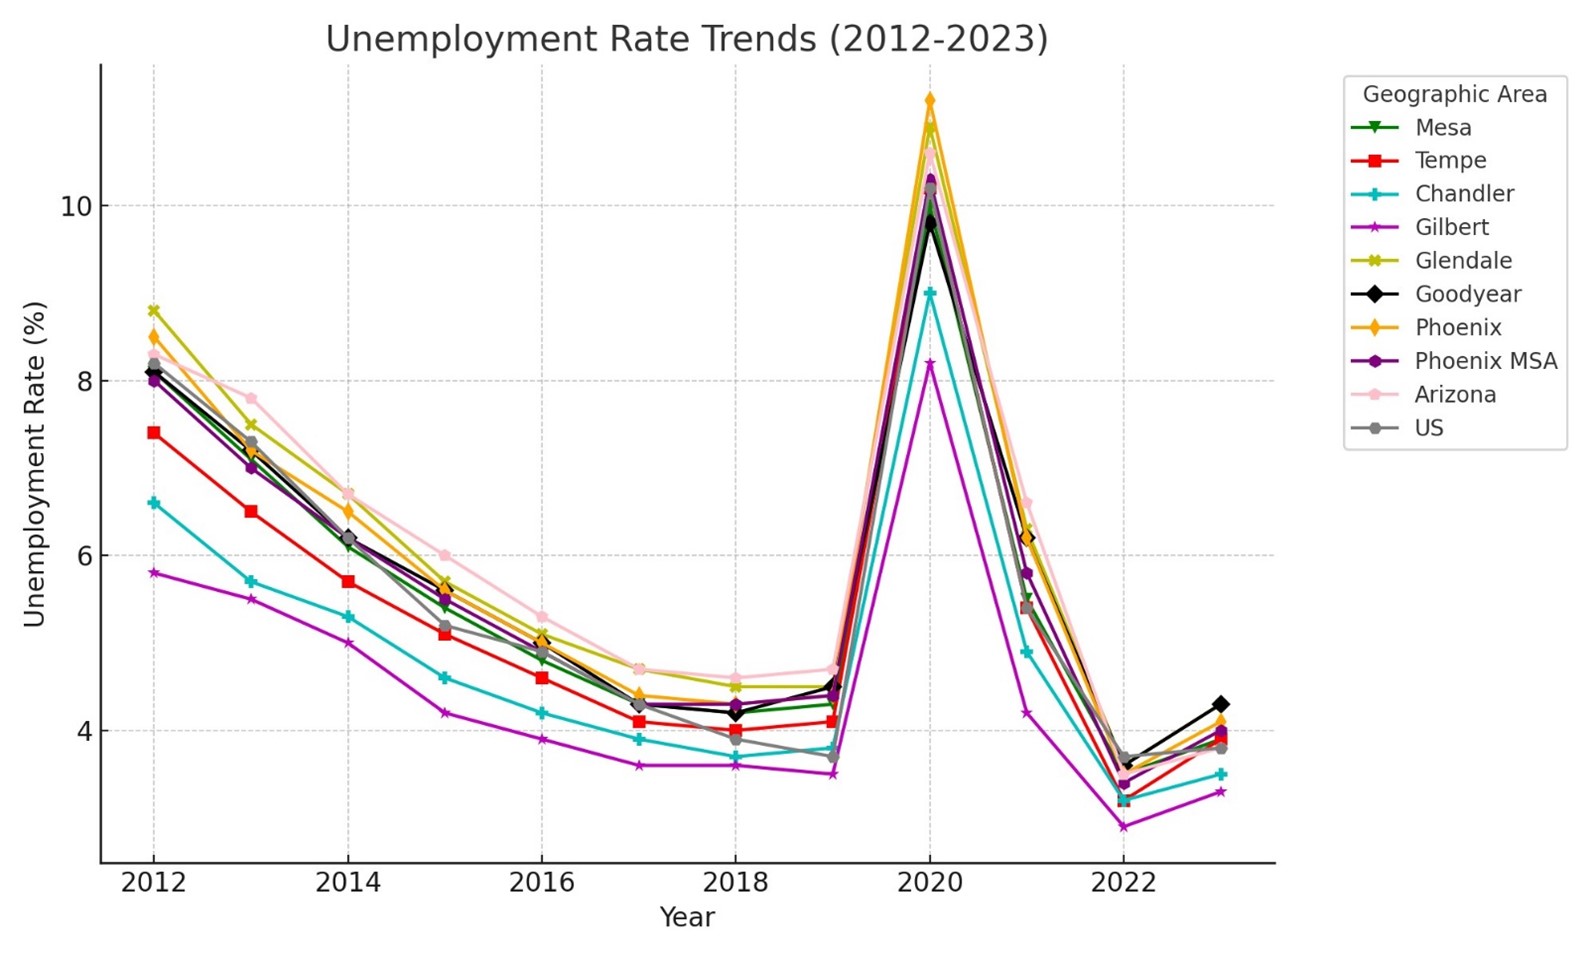
5.13 Unemployment Rate
1. Overall Trend:
○ From 2015 to 2023, there is a general trend of decreasing unemployment rates across cities, reflecting economic recovery post the 2008 recession and up until the COVID-19 pandemic in 2020, followed by recovery efforts.
○ The year 2020 shows a sharp spike in unemployment across all regions due to the pandemic's economic impacts, with cities like Phoenix and Glendale experiencing rates over 10%.
2. City Comparisons:
○ Scottsdale, Gilbert, and Chandler consistently maintain lower unemployment rates compared to cities like Phoenix and Glendale, indicating stronger local economies or industries less impacted by national downturns.
○ Phoenix MSA (Metropolitan Statistical Area) and Arizona state typically hover near or slightly above the national average, indicating a closer alignment with national economic trends.
3. Yearly Insights:
○ 2015–2019: Gradual decreases in unemployment rates in most cities, indicating economic growth and stability during this period.
○ 2020: Sharp increase across all cities and regions due to the COVID-19 pandemic. Unemployment rates soar to double digits, reflecting severe economic disruption.
○ 2021: A decline in unemployment as economies began recovering, but cities like Phoenix still show slightly elevated rates compared to others like Scottsdale and Gilbert.
○ 2022-2023: Unemployment rates significantly drop, with 2023 marking a near return to pre-pandemic levels in many cities, indicating recovery.
Key Insights:
● Resilient Cities: Gilbert and Scottsdale consistently show some of the lowest unemployment rates, suggesting strong local economies or robust recovery efforts.
● Pandemic Impact: The spike in 2020 is a clear reflection of the pandemic’s widespread economic impact, with all cities showing significantly higher rates than in previous years.
● Recovery: By 2023, most cities have recovered to unemployment rates around or below 4%, highlighting successful recovery strategies.


