5.09 CIP On Time Completion Rate
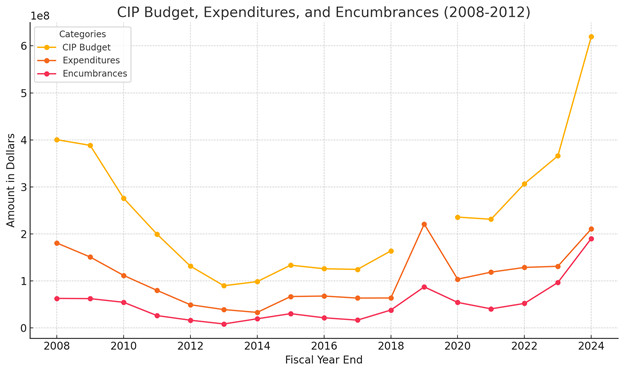
The graph above illustrates the trends in CIP (Capital Improvement Plan) budget, expenditures, and encumbrances from fiscal years 2008 to 2012.
Key insights:
1. CIP Budget Decline:
There is a significant reduction in the CIP budget over time, decreasing from over $400 million in FY 2008 to around $130 million by FY 2012. This could reflect changes in the city or organization’s funding priorities or economic constraints.
2. Expenditures & Encumbrances:
Expenditures (funds already spent) and encumbrances (funds committed but not yet spent) also decrease along with the overall budget.
Despite the reduction in the budget, expenditures and encumbrances remain relatively proportional, suggesting that spending patterns have adjusted to the lower available budget.
3. Encumbrances vs. Expenditures:
Encumbrances make up a smaller portion of the budget compared to expenditures. This indicates that a significant amount of allocated funds is actively spent within the fiscal year rather than being committed for future projects.
These trends suggest a steady decline in CIP funding and expenditures, possibly driven by external financial or organizational shifts.