Strong Community Connections
2.04 City Website Satisfaction
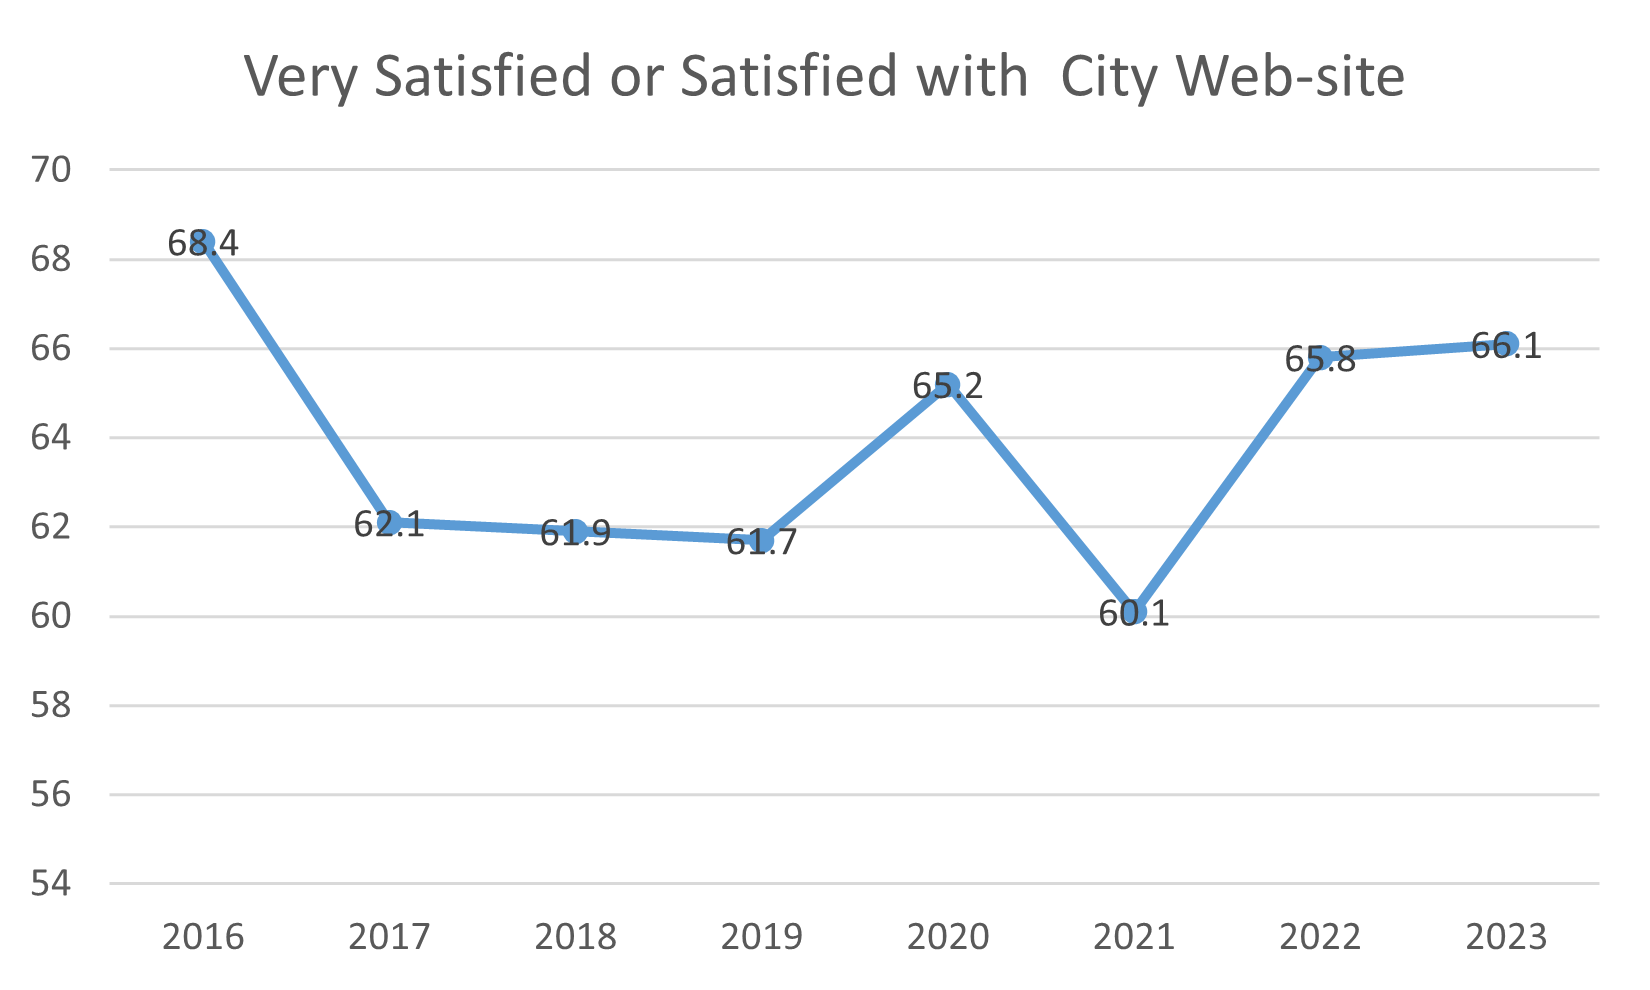
- Satisfaction Trends:
User satisfaction with the city website has experienced fluctuations over the years, with a general downward trend in the earlier years followed by a gradual recovery. - Yearly Performance:
2016: Satisfaction was relatively high at 68.4%, indicating a strong initial user experience.
2017-2019: A decline in satisfaction to 62.1%, 61.9%, and 61.7% suggests users' concerns regarding the website's functionality or content.
2020: A slight increase to 65.2% reflects improvements.
2021: Satisfaction dipped again to 60.1%, indicating ongoing challenges or user dissatisfaction.
2022: A rebound to 65.8% signifies positive changes or adjustments in user experience.
2023: A further increase to 66.1% shows ongoing improvements, though still below the initial satisfaction levels in 2016.